Sediment Deposition
overview
Both deforestation and construction practices result in increased erosion and the movement of soil. This soil erosion will result in sediment deposition in nearby streams. The following methods were used to assess the degree of sediment loading due to the pipeline in our stream reaches and the particle composition of the collected sediments.
methodology
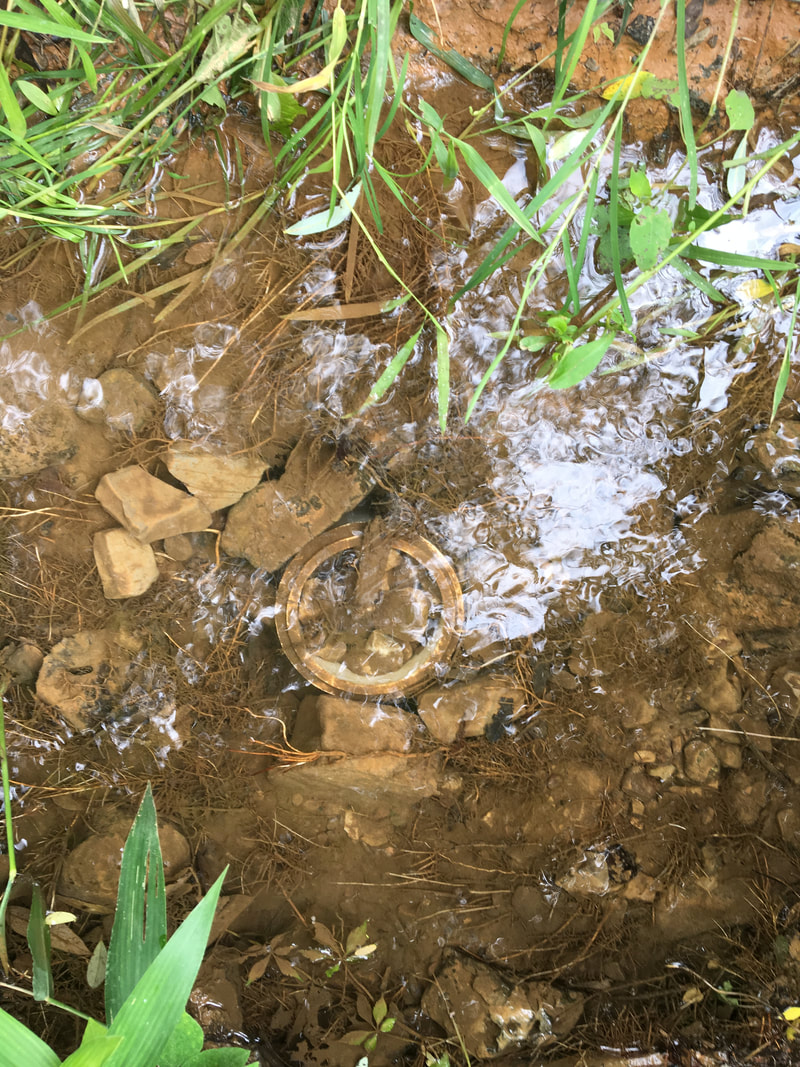
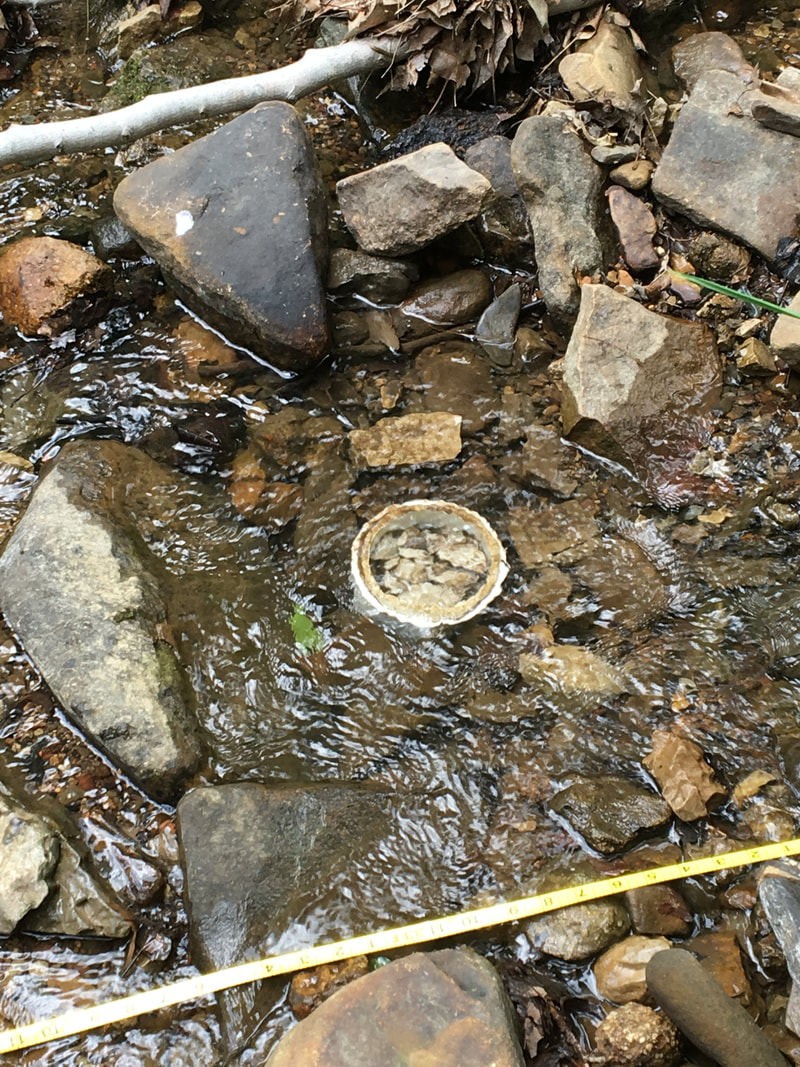
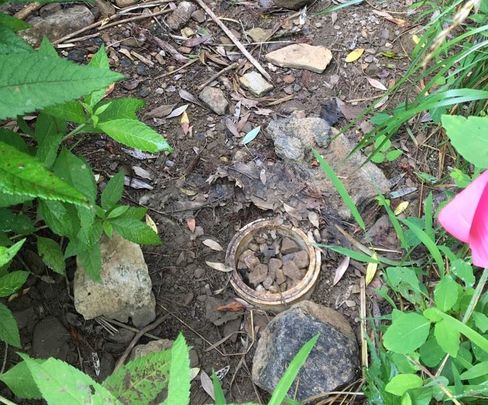
Embedded sediment samplers following the design from (Hedrick, 2005), were created and installed within the four sample reaches. At each site a riffle section was selected for the placement of three samplers to be used to quantify deposited sediments. The picture below offers a visual of what one looks like after being embedded. They remained in the streams for close to 2 weeks at which point they were collected and new ones were installed in their place for continous sampling. In the lab, the rocks were washed and the remaining solution was sieved through a 2mm sieve in preparation for oven drying. Then they were baked at 60C until water had burned off, weighed, placed in ovens again at 105C to burn off the organic material, and then weighed one last time to obtain just the mass of the sediment.
Once processed, a subsample was extracted from each to be put through a particle synthesizer to find the percentage of sands, silts, and clays to determine composition. A soil texture triangle was used to determine the soil texture of each sample based on the percentages of three particle sizes: clay is <2 micrometers (µm), silt is 2-50µm, and sand is >50µm.
Once processed, a subsample was extracted from each to be put through a particle synthesizer to find the percentage of sands, silts, and clays to determine composition. A soil texture triangle was used to determine the soil texture of each sample based on the percentages of three particle sizes: clay is <2 micrometers (µm), silt is 2-50µm, and sand is >50µm.
results
The collected sediments varied slightly in composition among sites and over time. Across all samples, clay was consistently low (<2%), and sands and silts were fairly consistent too, with the majority registering with a soil texture of Loamy Sand. However, downstream of the pipeline showed an increase in silts as seen from figure 1 where the red circles are located. Visually, there is a noticeable difference between upstream and downstream, with greater amounts of fines and a difference in the color of collected sediments. All sites had brown sediments, except downstream was orange in color (Figure 3).
The first round of collected samples showed a significant difference in quantity of sediment between upstream and downstream of the pipeline (p-value: 0.006) as shown in figure 2. In the second set of samples, there was a large decrease in trapped sediments for the downstream site, and all other sites decreased except upstream which varied only slightly. Quantities were impacted early on by disruption from preforming other experiments within the streams, likely causing higher masses in general compared to the second round. However, late in our sampling period, there was a large drop in baseflow resulting in zero flow, drying out the traps.
The first round of collected samples showed a significant difference in quantity of sediment between upstream and downstream of the pipeline (p-value: 0.006) as shown in figure 2. In the second set of samples, there was a large decrease in trapped sediments for the downstream site, and all other sites decreased except upstream which varied only slightly. Quantities were impacted early on by disruption from preforming other experiments within the streams, likely causing higher masses in general compared to the second round. However, late in our sampling period, there was a large drop in baseflow resulting in zero flow, drying out the traps.
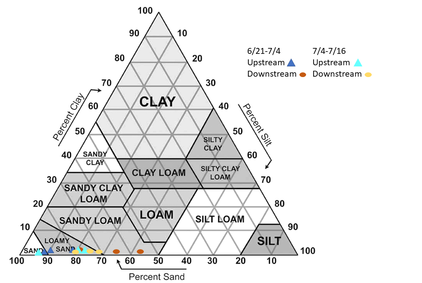
Figure 1. Soil composition for upstream and downstream
|
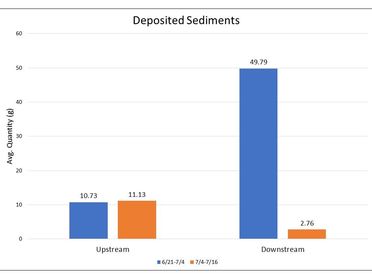
Figure 2. Average sediment quantities for upstream and downstream for both sampling periods
|
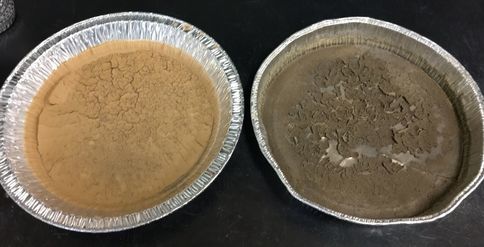
Figure 3. Dried sediment samples: downstream(left), upstream(right)
conclusion
The results show that there has been some addition of sediments from the construction of the pipeline given the quantity increase below the crossing, color of sediment collected, and the variation in soil texture with more silts then any of the other sites. However, there were unfortunate unavoidable disruptions throughout sampling times that, as a result, cause the quantity data to be inconclusive. During the first round of sampling, disruption occurred due to other experiments occurring within the reaches to contribute an unknown amount into the traps. These factors were not present for the second round of sampling, however due to lack of rain, the downstream site ran dry resulting in much lower levels then first measured (below image). There was obvious color difference (above image) and a greater amount of fines found within the downstream site, which points towards some pipeline disturbances. Further sampling would be required to control for the for mentioned conflicts to generate more representative data. As for particle composition among the reaches; loamy sand, sand, and sandy loams were found. The downstream was the only one to result in sandy loams, and had more silts amongst the sites. This could be a result of erosion and sediment deposition, but the types of soils that have been altered by construction are unknown.
References: Lara B. Hedrick , Stuart A. Welsh & James D. Hedrick (2005) A New Sampler Design for Measuring Sedimentation in Streams, North American Journal of Fisheries Management, 25:1, 238-244, DOI: 10.1577/M03-236.1
