soil properties
overview
This study established baseline information for soil properties along the pipeline right-of-way. The purpose is to revisit these locations and analyze the same soil properties once pipeline reclamation finishes, and then compare values. This study focuses on aggregate stability, or how well packaged are soil particles and their respective "clumps". This study used Integrated Aggregate Stability (IAS) methodology, which is an unconventional and up-and-coming method to more accurately and precisely analyze aggregate stability.
methodology
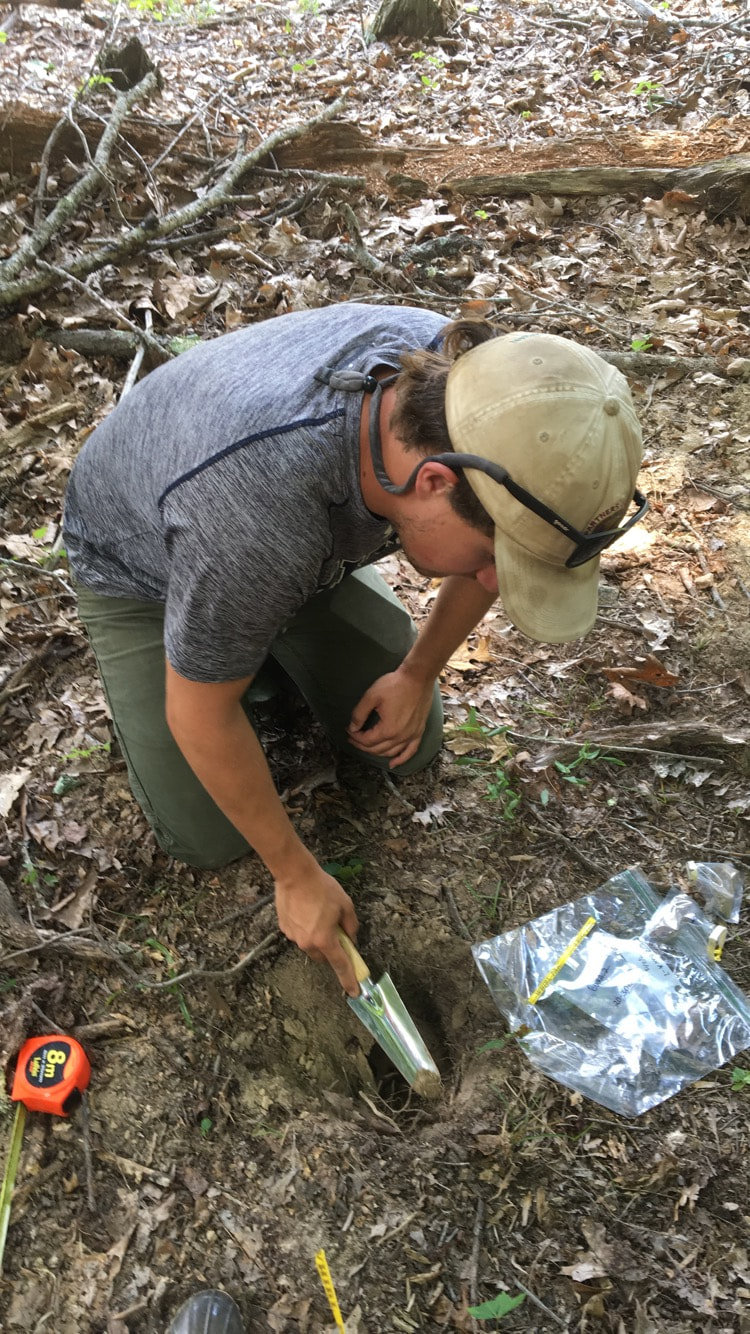
Soil samples were obtained from two different sites (A and B) near the pipeline right-of-way in the Mill Creek watershed. At each site, four samples were taken, where each sample collected soils from varying depths: 0-5cm, 5-10cm, 10-20cm, and 20-30cm. Due to site constrictions, 20-30cm samples were not collected at 3/4 of site A samples.
Samples were then air dried for a period of 72 hours.
Samples then were put into through the IAS, using 0 energy sonication, 0.25 sonication, and Particle Size Analysis (PSA) which consists of and 0.25 sonication with 4 hour shaking and calgon (dispersion agent).
Three cumulative distribution functions (CDF) illustrate the differences in aggregate stability by finding the differences in the areas of the curve by comparing 0 energy with the PSA and 0.25 energy with PSA . (I am going to try to find some graphs). These values were compared to the changes in aggregate stability, from 0/PSA and 0.25/PSA values. The values will then be compared to the samples taken after reclamation efforts.

results
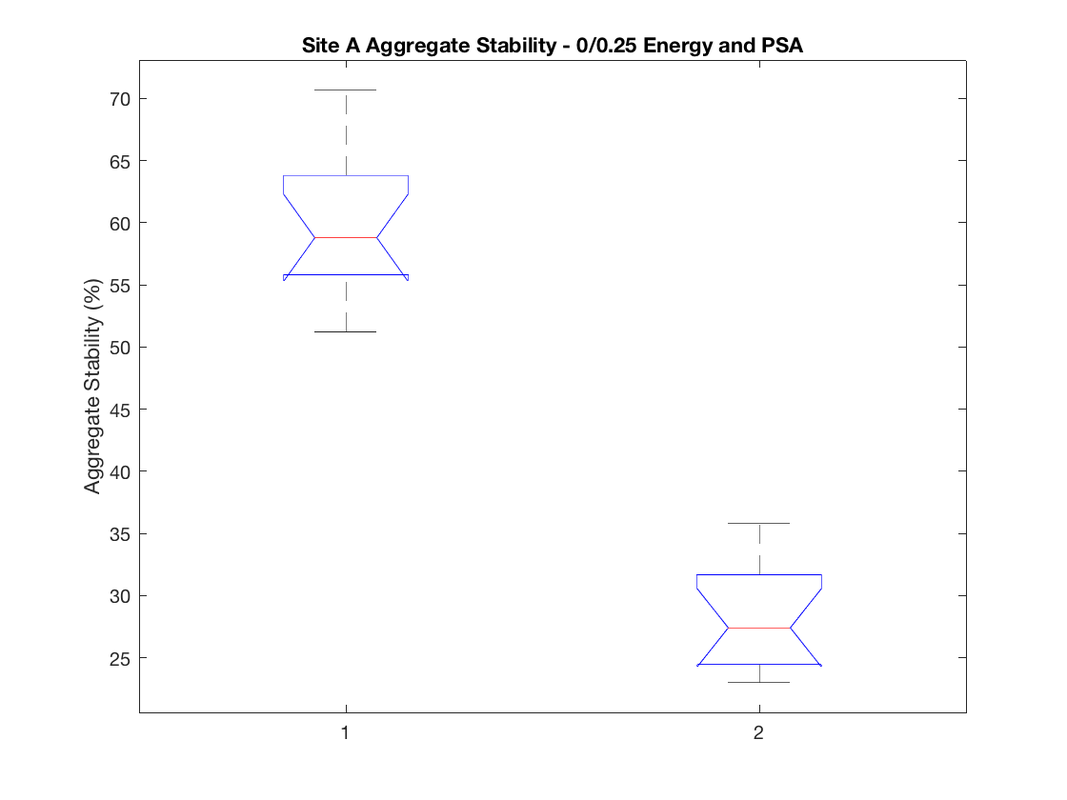
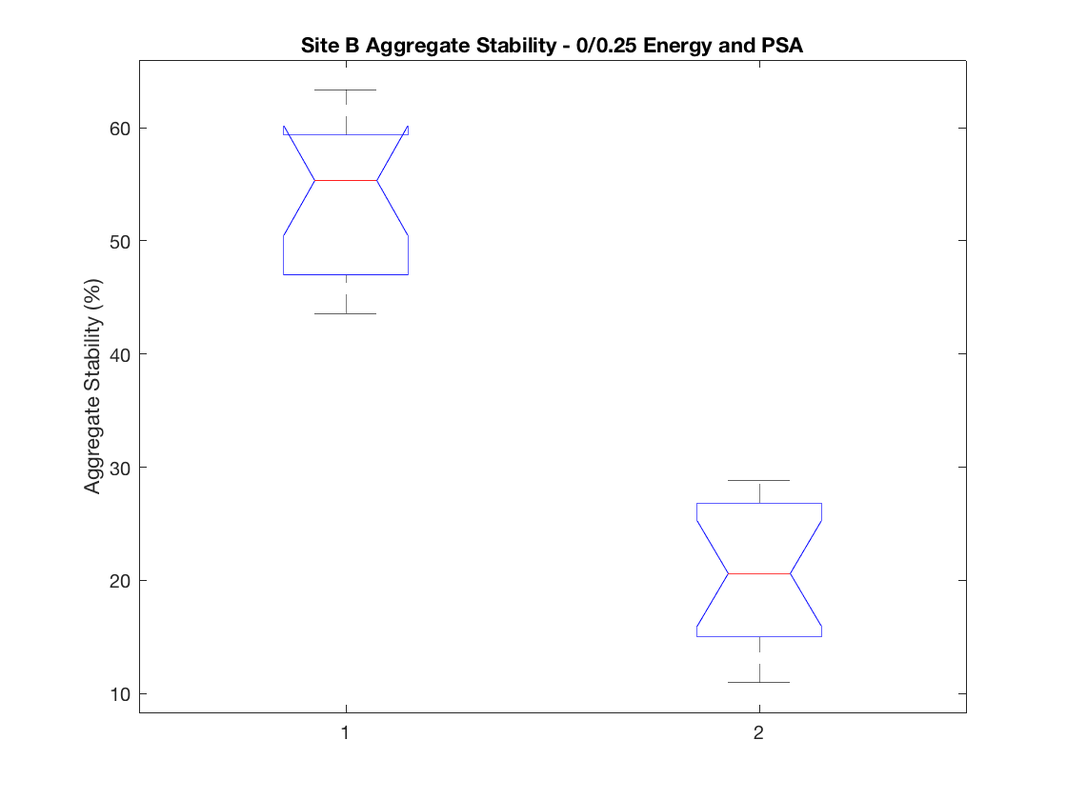
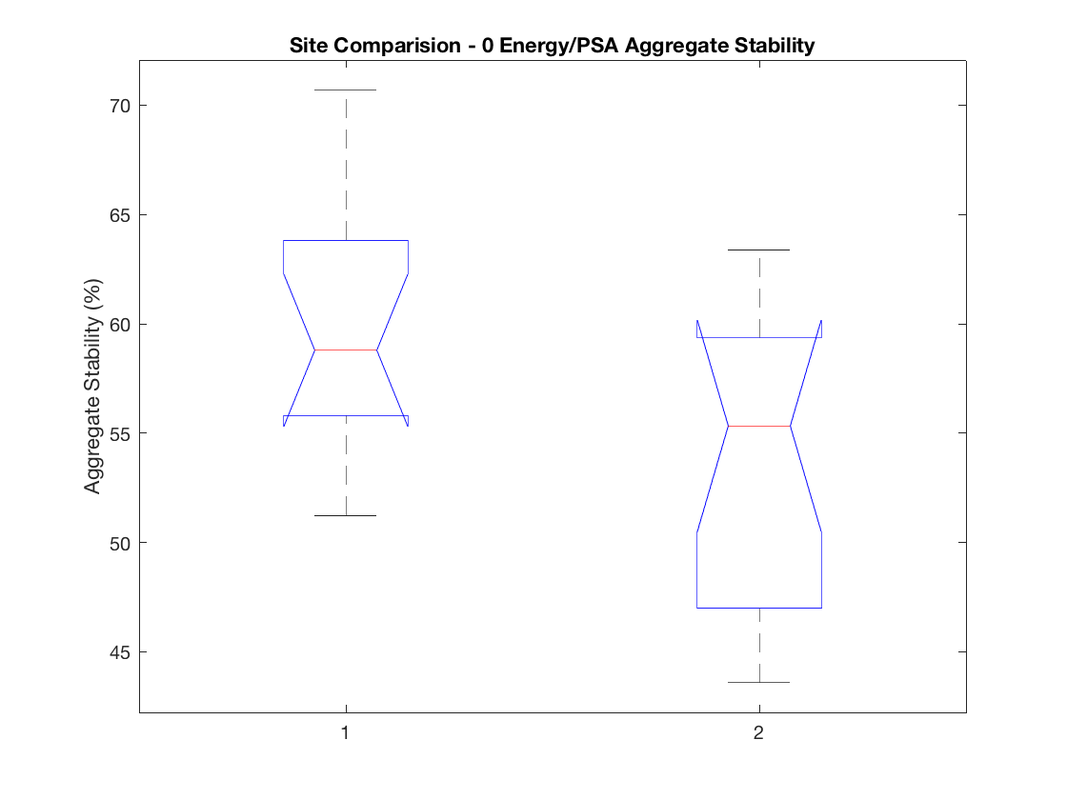
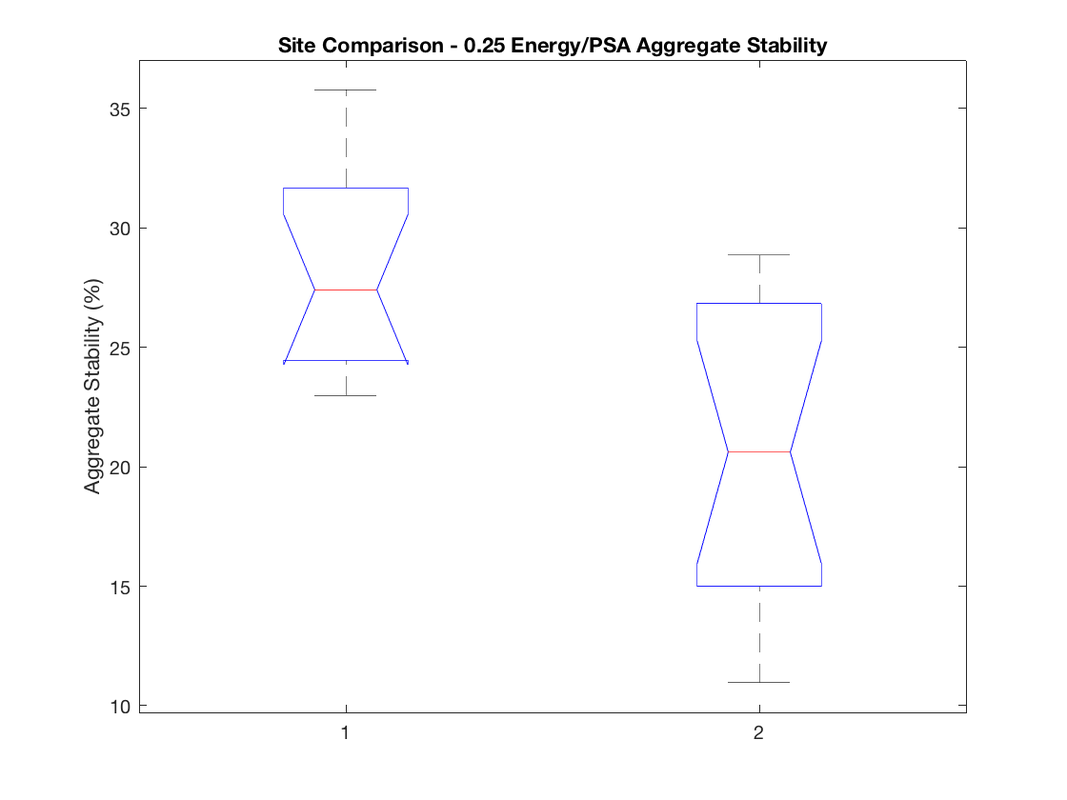
Below show box plots for comparing various aggregate stability values values. From left to right/top to bottom: Site A 0 energy and 0.25 energy models, Site B 0 energy and 0.25 energy models, comparison of Site A/B of 0 energy models, and comparison of Site A/B of 0.25 energy models.
conclusion
Significant changes exist between the aggregate stability values, comparing 0/PSA and 0.25/PSA energy levels. Using a 1-sided ANOVA test, the resulting p-value was 1.85x10^-14 for site A, and 2.514x10^-15 for site B.
Site A and Site B also varied significantly from each other, comparing the same aggregate stability models, with a p-value of 0.0157 for 0/PSA and 0.0015 for 0.25/PSA comparisons.
Hopefully, future soil samples will be taken following pipeline construction and reclamation and be compared to the values found herein.
References
Ryan Stewart and Ayush Joshi Gyawali contributed to the methodology and analysis of this study, with supporting papers pending in peer-review.
